

ABOUT ME
I am a Excel Lover Based in Germany
If you get to know me, there’s one sentence that will definitely stick in your mind: I love Excel. Not just because it helped me believe in myself, but because it keeps evolving every single day. It’s the tool that companies all around the world rely on — and I just can’t get enough of it.
When it comes to shaping data and creating visuals in Power BI that tell the story in just one glance, I’m all in – right down to the tiniest detail. If someone looks at one of my dashboards and just gets it without me saying a word, that’s when I know I’ve nailed it.
I’m all about data, and Power Query is really my sweet spot (or should I say… sheet spot?). Sometimes I turn messy data into… well, even more mess — but only for a little while, before I wrangle it into clear, useful insights that actually make sense.
Hanging out in Excel since 2017 – that’s 8 years of turning data into insights!
ABOUT EXCEL
I am a Excel Lover Based in Germany
I’m all about data, and Power Query is really my sweet spot (or should I say… sheet spot?). Sometimes I turn messy data into… well, even more mess — but only for a little w
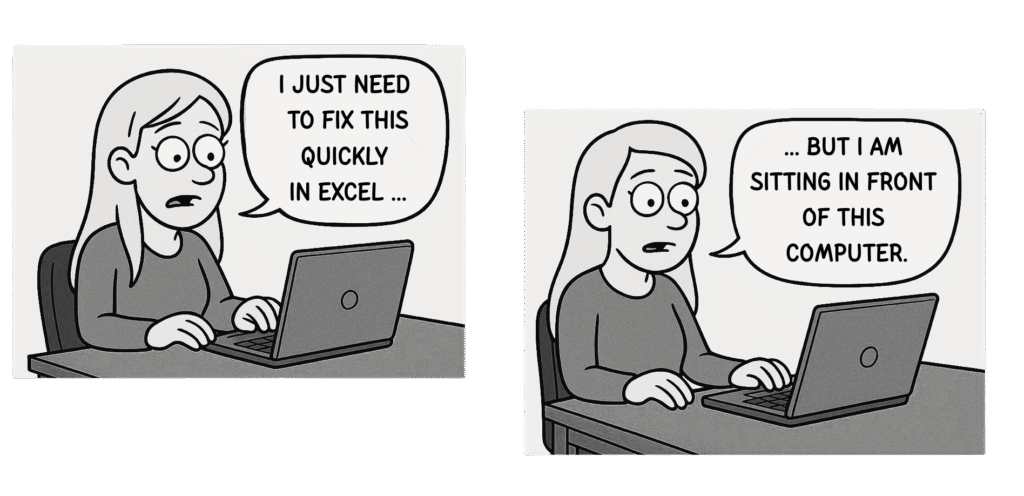
When I first sat down in front of Excel, I spent hours doing things that could actually be done with just one single click — like removing duplicates. I cursed at Excel, slammed my laptop shut in frustration, and swore I was done with it.
But then I learned something: the truth was… the problem was, once again, sitting right in front of the computer. Excel wasn’t the bad guy — it just doesn’t speak the way I was trying to talk to it. It has its own language.
Today, I like to think of myself as a translator — turning human questions into Excel’s logic and back again. And that’s exactly what this blog is about: breaking down the “Excel language” so you and your spreadsheets finally get along.
This blog will be more than just another tutorial — it’s going to be the first one that dives into the emotions behind working with Excel. Because let’s be honest: spreadsheets can make us laugh, cry… and sometimes want to throw the laptop out the window.
Ein Kommentar